Research
May 29, 2025
A Deeper Understanding of Motor Control in Stroke: Clinical Insights from Tonic Stretch Reflex Threshold and μ for Spasticity and Upper Limb Recovery

Introduction
Stroke often leads to persistent upper limb (UL) sensorimotor impairments, with traditional rehabilitation showing limited effectiveness—partly due to inadequate targeting of underlying motor control deficits. Current clinical measures often fail to capture subtle changes in impairment, highlighting the need for more objective spasticity biomarkers after stroke.
To ground clinical practice in neurophysiological theory, we will analyze in this review two competing motor control frameworks and their implications for stroke recovery.
The Computational Approach – This theory compares movement control to a robotic system, where the brain pre-calculates precise motor commands (e.g., joint angles, muscle forces) using internal models. It assumes the nervous system can inversely compute the exact neural inputs needed to produce a desired movement. However, this approach struggles with fundamental biological realities. Motoneurons operate on threshold principles—they either fire or don’t—making it impossible to precisely reverse-engineer commands for actions like isometric contractions (e.g., pushing against an immovable object), or movement that might not trigger EMG activity. Additionally, the model fails to explain how movements adapt seamlessly to real-world unpredictability, such as catching a falling object.
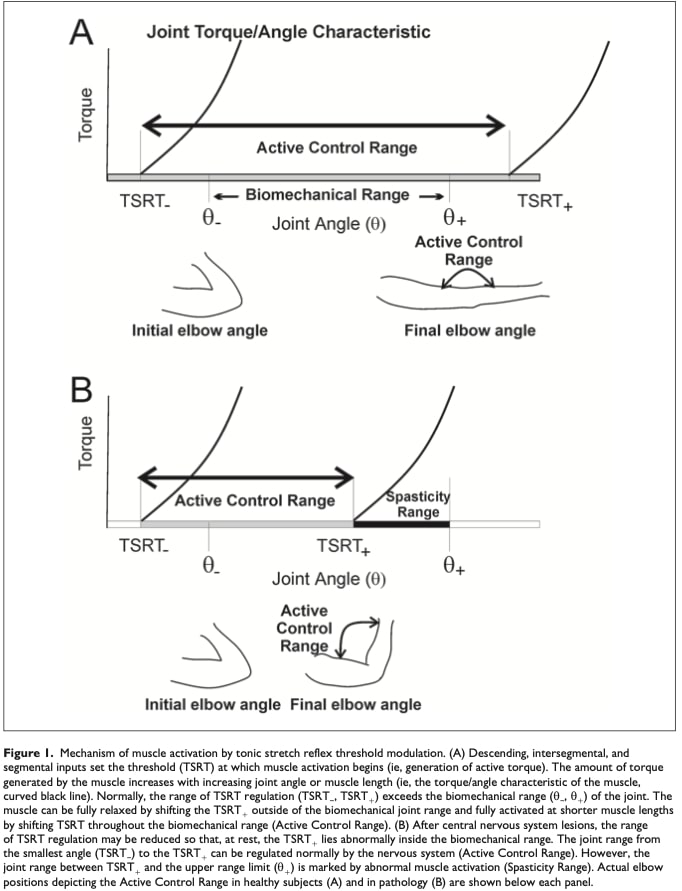
Referent Control Theory (RCT) – RCT addresses computational limitations by proposing a fundamentally different strategy: rather than computing specific commands, the nervous system controls movement by adjusting activation thresholds (λ) for muscles. Imagine λ as a thermostat setpoint for muscles—just as a heater turns on when room temperature drops below its threshold, muscles activate only when stretched beyond their λ (e.g., a biceps activating at 90° elbow flexion). These thresholds dynamically determine how muscles respond to environmental interactions, with the Tonic Stretch
Reflex Threshold (TSRT)—clinically measurable in joint angles—serving as a direct marker of this control system. Post-stroke, impaired threshold regulation manifests as spasticity (when λ gets “stuck” at long muscle lengths, causing spasticity) or weakness (when λ cannot shift to short lengths). Crucially, RCT explains why training within a patient’s intact “active control zone” (avoiding spasticity thresholds) improves kinematics (Levin, 2023) : it aligns therapy with the nervous system’s innate threshold-based logic.
Refer to Figure 1 for a schematic representation of TSRT’s threshold-based mechanism and its clinical implications for spasticity assessment.
Study Objective: Investigate relationships between TSRT/μ and clinical UL spasticity/motor function scores in acute/chronic stroke, testing whether these measures better reflect sensorimotor deficits and providing spasticity biomarkers after stroke.
Methods
The study analyzed physiological and clinical measures collected from eight studies. The physiological measures included the tonic stretch reflex threshold (TSRT) angle and μ (velocity sensitivity), while clinical assessments comprised the Modified Ashworth Scale (MAS) for spasticity and the Fugl-Meyer Assessment for Upper Extremity (FMA-UE) for motor impairment.
Three studies involved multiple evaluations per participant (≥3 pre/post assessments). Two additional studies featured two evaluations per participant (pre/post), and three others included single evaluations.
The subject
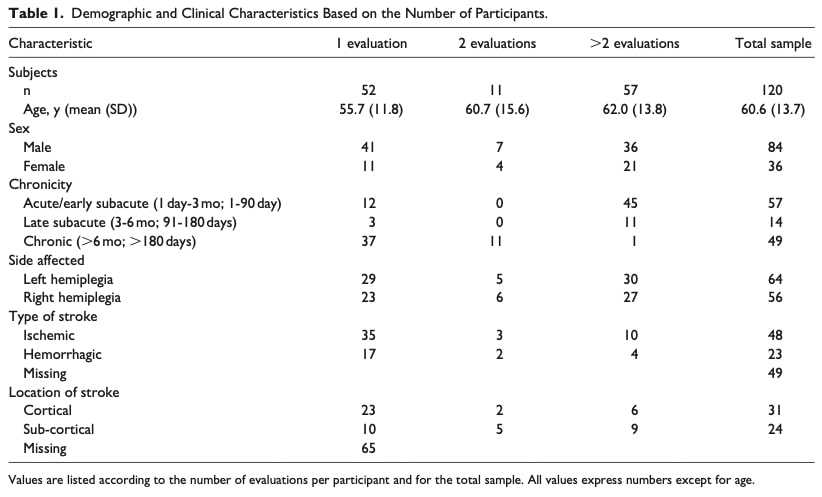
The study included individuals aged 18 to 80 years with ischemic or hemorrhagic stroke in either hemisphere, resulting in arm paresis (Chedoke-McMaster Arm Scale score 2– 6/7). Eligible participants could voluntarily flex or extend their elbow at least 30° and exhibited increased resistance to passive stretch in elbow flexors (Modified Ashworth Scale > 1). Most participants (six studies) were in the chronic phase of stroke (>6 months post-stroke). Demographic data (i.e., age, sex, stroke chronicity, type, and lesion location/side) were collected from each study and are presented in Table 1.
Measurements approach
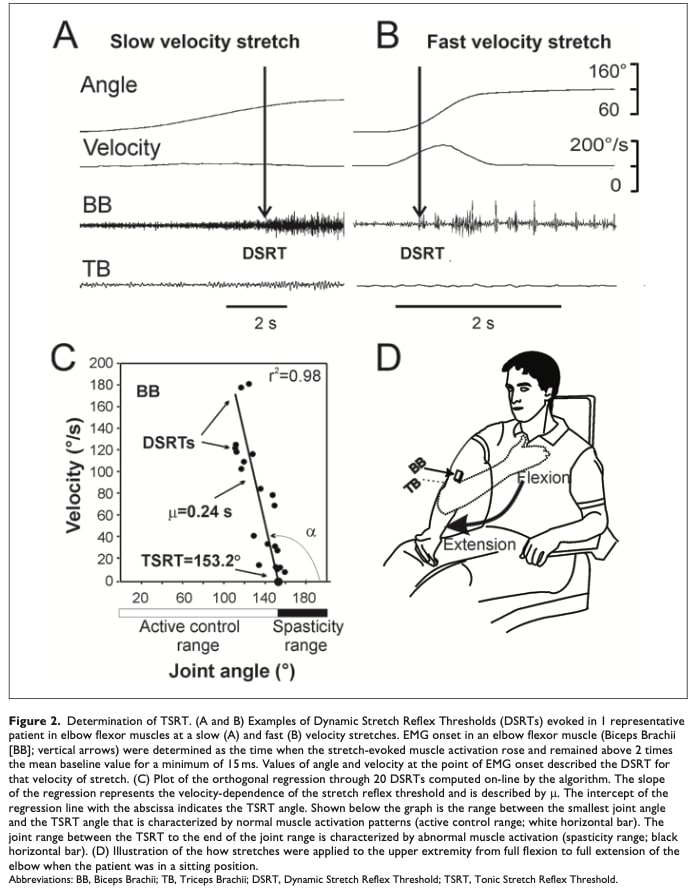
The studies measured spasticity using the Montreal Spasticity Measure (MSM), which combines EMG sensors on the biceps and triceps with an electrogoniometer to track elbow movements. Participants’ arms were passively stretched at varying speeds while muscle responses were recorded. This method enabled calculation of two critical spasticity biomarkers after stroke: the tonic stretch reflex threshold (TSRT) and velocity sensitivity (μ).
Key Metrics Explained
TSRT (Tonic Stretch Reflex Threshold)
Measured in degrees, TSRT represents the joint angle—at the elbow—at which a muscle begins to resist stretch without any applied movement velocity. In individuals who have experienced a stroke, abnormal TSRT values reflect impaired motor control. Higher TSRT values suggest increased spasticity (overactive reflexes), whereas lower values indicate a reduced joint range where abnormal muscle activation occurs.
μ (Velocity Sensitivity)
The μ value is measured in seconds. This metric indicates how increasing stretching speeds affect the threshold at which muscles reflexively activate—that is, how faster stretching leads to earlier reflex responses (at smaller joint angles). A lower μ value suggests reduced stretch reflex excitability, meaning the nervous system is better able to adapt to varying movement speeds. This is a sign of decreased spasticity.
DSRT (Dynamic Stretch Reflex Threshold)
These are the actual reflex thresholds measured at specific stretching speeds. By testing multiple speeds and plotting the DSRTs, researchers can determine both the TSRT (where the trend line crosses zero velocity) and μ (the slope of the line).
Reliability and Clinical Significance
The MSM system demonstrates strong reliability for TSRT measurements, showing consistency across testers and sessions. Clinically meaningful improvement corresponds to TSRT changes of 6.8°-11.2°. While higher TSRT angles and lower μ values generally indicate reduced spasticity and better motor function post-rehabilitation, comprehensive reliability data for μ remains unavailable.
Clinical measures
Two commonly used tools were used to assess motor function and spasticity. The Modified Ashworth Scale (MAS) rates how much a muscle resists being stretched, regardless of speed. It uses a 6-point scale from 0 to 4, where higher scores mean more resistance. Although it’s quick and easy to use, MAS has limited accuracy and reliability, especially depending on the muscle tested.
The Fugl-Meyer Assessment for the Upper Extremity (FMA-UE) is a more reliable and detailed tool. It measures arm and hand movements, reflexes, and coordination. The total score ranges from 0 to 66, with 66 representing normal movement. The researchers also collected specifically the Section A scores of the test (out of 36 points), which focuses on shoulder and elbow movements and reflexes.
Statistical Analysis
The study used regression analysis to determine how much TSRT and μ (independent variables) explained variance in upper limb function (FMA-UE scores). DSRTs were excluded as they were only used to calculate TSRT. Analyses controlled for multicollinearity (r≥0.7), heteroscedasticity, and outliers using SPSS v29 (p<0.05). This determined the predictive value of these spasticity measures for motor impairment.
The statistical analysis used will be discussed in greater details in the Talk nerdy to me section.
Results
The analysis included data from 120 stroke patients (mean age 60.3±13.7 years) with ischemic/hemorrhagic cortical or subcortical lesions causing hemiplegia/paresis. Participants spanned acute, subacute, and chronic recovery phases. Key findings:
- Chronic phase had significantly more males
- No differences in upper limb impairment severity across phases
- Age distribution was similar among groups
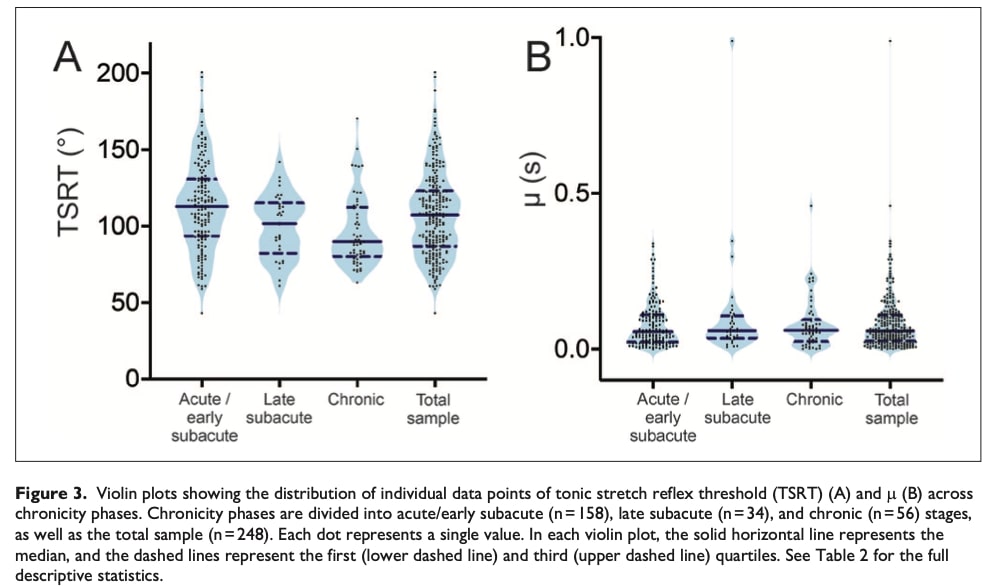
TSRT Differences Across Stroke Phases
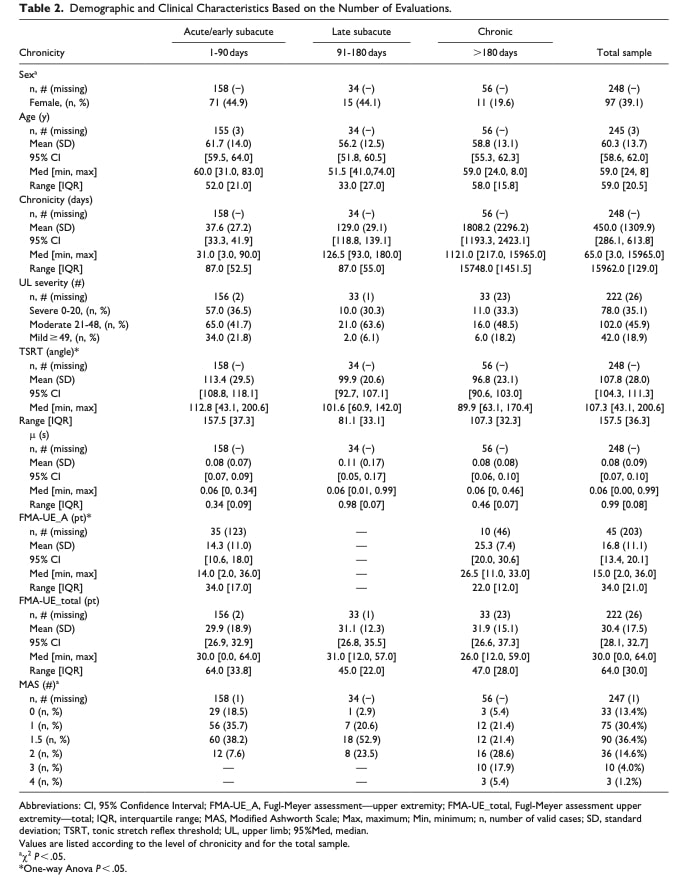
The analysis revealed significant differences in Tonic Stretch Reflex Threshold (TSRT) among acute/early subacute (1-90 days), late subacute, and chronic stroke groups. Post- hoc comparisons showed the acute/early subacute group had 16.64° higher TSRT than the chronic group, indicating greater spasticity early post-stroke.
Velocity Sensitivity (μ) Results
No significant group differences were found for velocity sensitivity (μ) across stroke phases. This suggests stretch reflex timing adaptations to movement speed remain consistent throughout recovery.
Clinical Measures Overview
While overall upper limb function (FMA-UE total) remained similarly impaired across recovery phases, acute/subacute patients showed significantly worse voluntary movement (FMA-UE_A) than chronic patients, whereas chronic cases exhibited more severe spasticity (MAS).
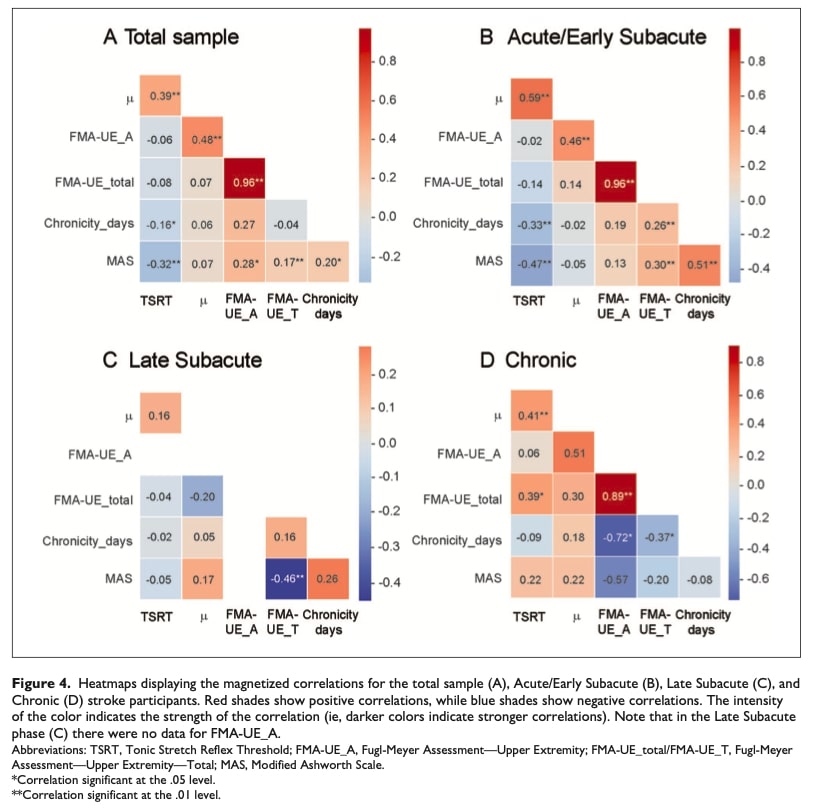
Relationship Between TSRT/μ and Clinical Measures
The heatmap analysis revealed distinct spasticity-motor function relationships throughout stroke recovery. Across all patients, higher TSRT (reflex threshold) correlated with increased μ velocity sensitivity, while both measures declined with time post-stroke and spasticity severity. Notably, μ’s strong positive link to voluntary movement suggests it best captures early motor control deficits.
- Acute/subacute: TSRT and μ showed the closest coupling with both strongly tied to MAS and chronicity, underscoring their clinical relevance in early assessment.
- Late-subacute: Only MAS and total motor function correlated negatively, highlighting spasticity’s growing functional impact.
- Chronic: TSRT correlated with both μ and overall function (FMA-UE_total) while μ’s link to voluntary control trended positive but nonsignificant.
Multiple Regression Analysis Results
Researchers used multiple regression to analyze how spasticity biomarkers after stroke (TSRT and μ values) predict variance in upper limb motor impairment, measured by FMA-UE subscales.
FMA-UE_A (Shoulder and elbow motor control)
The regression model significantly predicted 72.0% of the variance in FMA-UE_A scores. Both TSRT and μ were significant predictors, indicating that higher reflex thresholds (TSRT) and lower velocity sensitivity (μ) were associated with better voluntary movement control.
FMA-UE_Total (Overall Upper Limb Function)
The model accounted for 68.7% of the variance in total upper limb motor function. TSRT was a strong and significant predictor, whereas μ did not contribute meaningfully to the model. This suggests that while TSRT is strongly linked to overall motor recovery, velocity sensitivity (μ) does not independently influence global upper limb function.
Questions and thoughts
Why does this matter?
For research:
This study advances motor control theory by demonstrating how Referent Control Theory (RCT) resolves key limitations of computational models. RCT provides a physiologically grounded framework where movement emerges through interactions between the nervous system, musculoskeletal properties, and environmental constraints. At its core, RCT posits that the CNS controls movement by regulating muscle activation thresholds (e.g., TSRT) relative to joint position, rather than computing explicit motor commands. By validating TSRT and μ as spasticity biomarkers after stroke, this research reveals how impaired threshold regulation leads to specific movement abnormalities: spasticity arises when thresholds become fixed at excessive muscle lengths. These insights not only explain clinical observations but have also enabled the development of objective assessment tools, bridging theoretical principles with practical rehabilitation strategies.
For clinicians:
Current tools like FMA and MAS, though valuable, provide primarily qualitative assessments of motor impairment. Just as physiotherapy increasingly incorporates psychosocial evaluations through detailed interviews and forms, we must also enhance our biological assessment capabilities. TSRT and μ emerge as clinically
validated spasticity biomarkers after stroke, offering potential to revolutionize management by:
- Offering objective, quantifiable data
- Enabling more precise diagnoses
- Guiding personalized treatment plans
- Potentially improving functional outcomes
Talk nerdy to me
Statistical Analysis Explained
The study used a carefully designed statistical approach to understand how spasticity (measured by TSRT and μ) relates to motor recovery after stroke. Let’s break down why each method was chosen and what the results really mean.
Grouping Patients by Recovery Phase
Researchers divided participants into three key stages of stroke recovery: acute/early subacute (1-90 days), late subacute (91-180 days), and chronic (>180 days). This separation is crucial because the brain’s capacity for change and the nature of movement problems evolve dramatically across these phases. Early phases show rapid neural changes but unstable motor control, while chronic phases reveal more established (and often harder to modify) movement patterns.
Categorizing Motor Impairment
Upper limb function was classified using FMA-UE scores into severe (0-20), moderate (21-48), and mild (≥49) impairment categories.
Choosing the Right Descriptive Statistics
The researchers employed multiple statistical measures to accurately represent their data. For normally distributed variables, they reported means accompanied by standard deviations. When dealing with skewed distributions or outlier-prone data – a common occurrence in stroke recovery studies where patients often show highly variable progress – they utilized medians with interquartile ranges. Additionally, they included 95% confidence intervals to indicate the precision of their estimates. The median and interquartile range prove especially useful in these scenarios as they provide a more robust central tendency measure that isn’t unduly influenced by atypical cases.
Comparing Groups Statistically
For continuous variables like TSRT values and FMA-UE scores across recovery phases, analysis of variance (ANOVA) was used. This test identifies whether any significant differences exist between the three recovery groups. For categorical data like sex distribution or MAS severity categories, chi-square tests were more appropriate. The Bonferroni correction applied to post-hoc tests – allowing for more precise identification of difference in between groups- acts as a quality control measure, reducing the chance of false positive findings when making multiple comparisons between groups.
Understanding Relationships Through Correlation and Regression
Pearson correlation analysis revealed how strongly different variables moved together – for example, whether higher TSRT consistently associated with lower FMA-UE scores. However, correlation doesn’t imply causation. That’s where multiple regression became invaluable – it quantified how much of the variation in motor function could actually be predicted by spasticity measures while accounting for other factors. The finding that TSRT predicted 72% of voluntary movement variance (FMA-UE_A) and 68.7% of overall function (FMA-UE_Total) is particularly striking, suggesting TSRT captures something fundamental about post-stroke motor control.
Take-home messages
This study confirms that TSRT (tonic stretch reflex threshold) and μ (velocity sensitivity) are clinically useful spasticity biomarkers after stroke, grounded in Referent Control Theory (RCT). Unlike traditional scales like MAS, these measures objectively quantify how stroke disrupts the nervous system’s control of muscle activation thresholds.
For Your Practice:
The threshold-based logic of RCT demonstrates why movement retraining succeeds when therapists:
- Since TSRT measurement isn’t clinically feasible in most settings, identify functional movement boundaries through careful observation.
- Design exercises within this intact zone initially, avoiding spasticity-triggering positions (where TSRT is pathologically elevated)
- Progressively expand the active range as threshold regulation improves
For additional insights on stroke rehabilitation, explore Physiotutor’s review articles on: (1) virtual reality training for hand function recovery , and (2) the impact of feedback modalities on motor relearning post-stroke.
Reference
TWO MYTHS BUSTED & 3 KNOWLEDGE BOMBS FOR FREE
What university doesn’t tell you about shoulder impingement syndrome and scapula dyskinesis and how to massively level up your shoulder game without paying a single cent!