


Research
Hip
October 23, 2026
Hip Test Battery Reliability: Why the Limb Symmetry Index May Be Failing Your Patients

Hip flexion ROM and the medial hop test are the most reliable measures in a hip test battery (ICC up to 0.95)
All Limb Symmetry Index (LSI) calculations showed poor reliability (ICC < 0.50) with a mean MDC of ~27%
A change in LSI of less than ~27% cannot be distinguished from measurement error, questioning its use in return-to-sport decisions
Introduction
When assessing a sporting population, you would preferentially make use of a multimodal approach to document left-right deficits, as recommended by the evidence. If you work with hip pain or post-surgical hip patients, you’ve probably used the Limb Symmetry Index (LSI) at some point to help decide whether someone is ready to return to sport. As it’s quick and intuitive, since it doesn’t require reference values to compare with, these assessments are mostly used in musculoskeletal return-to-sport assessment. But how trustworthy is it to rely on the noninjured leg?
This study doesn’t just add another paper to the pile of hip outcome research. It’s the first to build a comprehensive, clinically applicable hip test battery (comprising ROM, strength, and functional tests) and systematically test its intra- and inter-rater reliability. For clinicians who rely on symmetry percentages to green-light return to sport, this is essential reading.
Methods
This is a cross-sectional reliability study in healthy recreational adults, conducted in Belgium. The test battery included active and passive hip ROM (flexion, internal/external rotation), isometric hip strength (flexors, abductors, adductors) via handheld dynamometry, and functional tests (medial hop, single-leg squat, modified Star Excursion Balance Test [SEBTm], squat endurance). LSI was calculated for relevant outcomes. Reliability was quantified using ICC, SEM, and MDC95%, with Bland-Altman analysis for LSI agreement. A subsample was retested after one week for the assessment of intra-rater reliability.
Eligibility criteria required the inclusion of healthy participants who were recreationally active, defined by engagement in at least two exercise sessions per week. They were currently free from hip disorders and had no relevant hip injury history. An International Hip Outcome Tool (iHOT-12-fr) score of at least 90/100 was required. Participants were excluded if they had prior hip surgery or had recovered from a lower-limb injury within the past 6 months.
The testing was conducted in the following order:
-
Range of motion assessment: using a digital inclinometer, hip flexion, internal rotation, and external rotation at 0° and 90° of hip flexion were first actively assessed, followed by a passive assessment. The onset of the contralateral limb movement was defined as the end-range.
-
Strength: assessed with a handheld dynamometer and an external fixation belt. The lever arm was defined as the length of the lower limb, measured individually from the greater trochanter to the apex of the medial malleolus. Values were converted to joint moments and normalized to body mass (Nm/kg). The dynamometer was placed at 3 cm above the medial malleolus or at the midfoot, depending on the type of measurement. Three rounds of 6-second maximal voluntary isometric contractions were performed, separated by 15 seconds of rest. Adductor-to-abductor ratios were calculated.
-
Functional tests:
-
Medial hop for distance, normalized for limb length (greater trochanter to the floor)
-
Single-leg squat, scored on an 8-point qualitative observation scale
-
Squat endurance test at 100° of knee flexion, measured in seconds
-
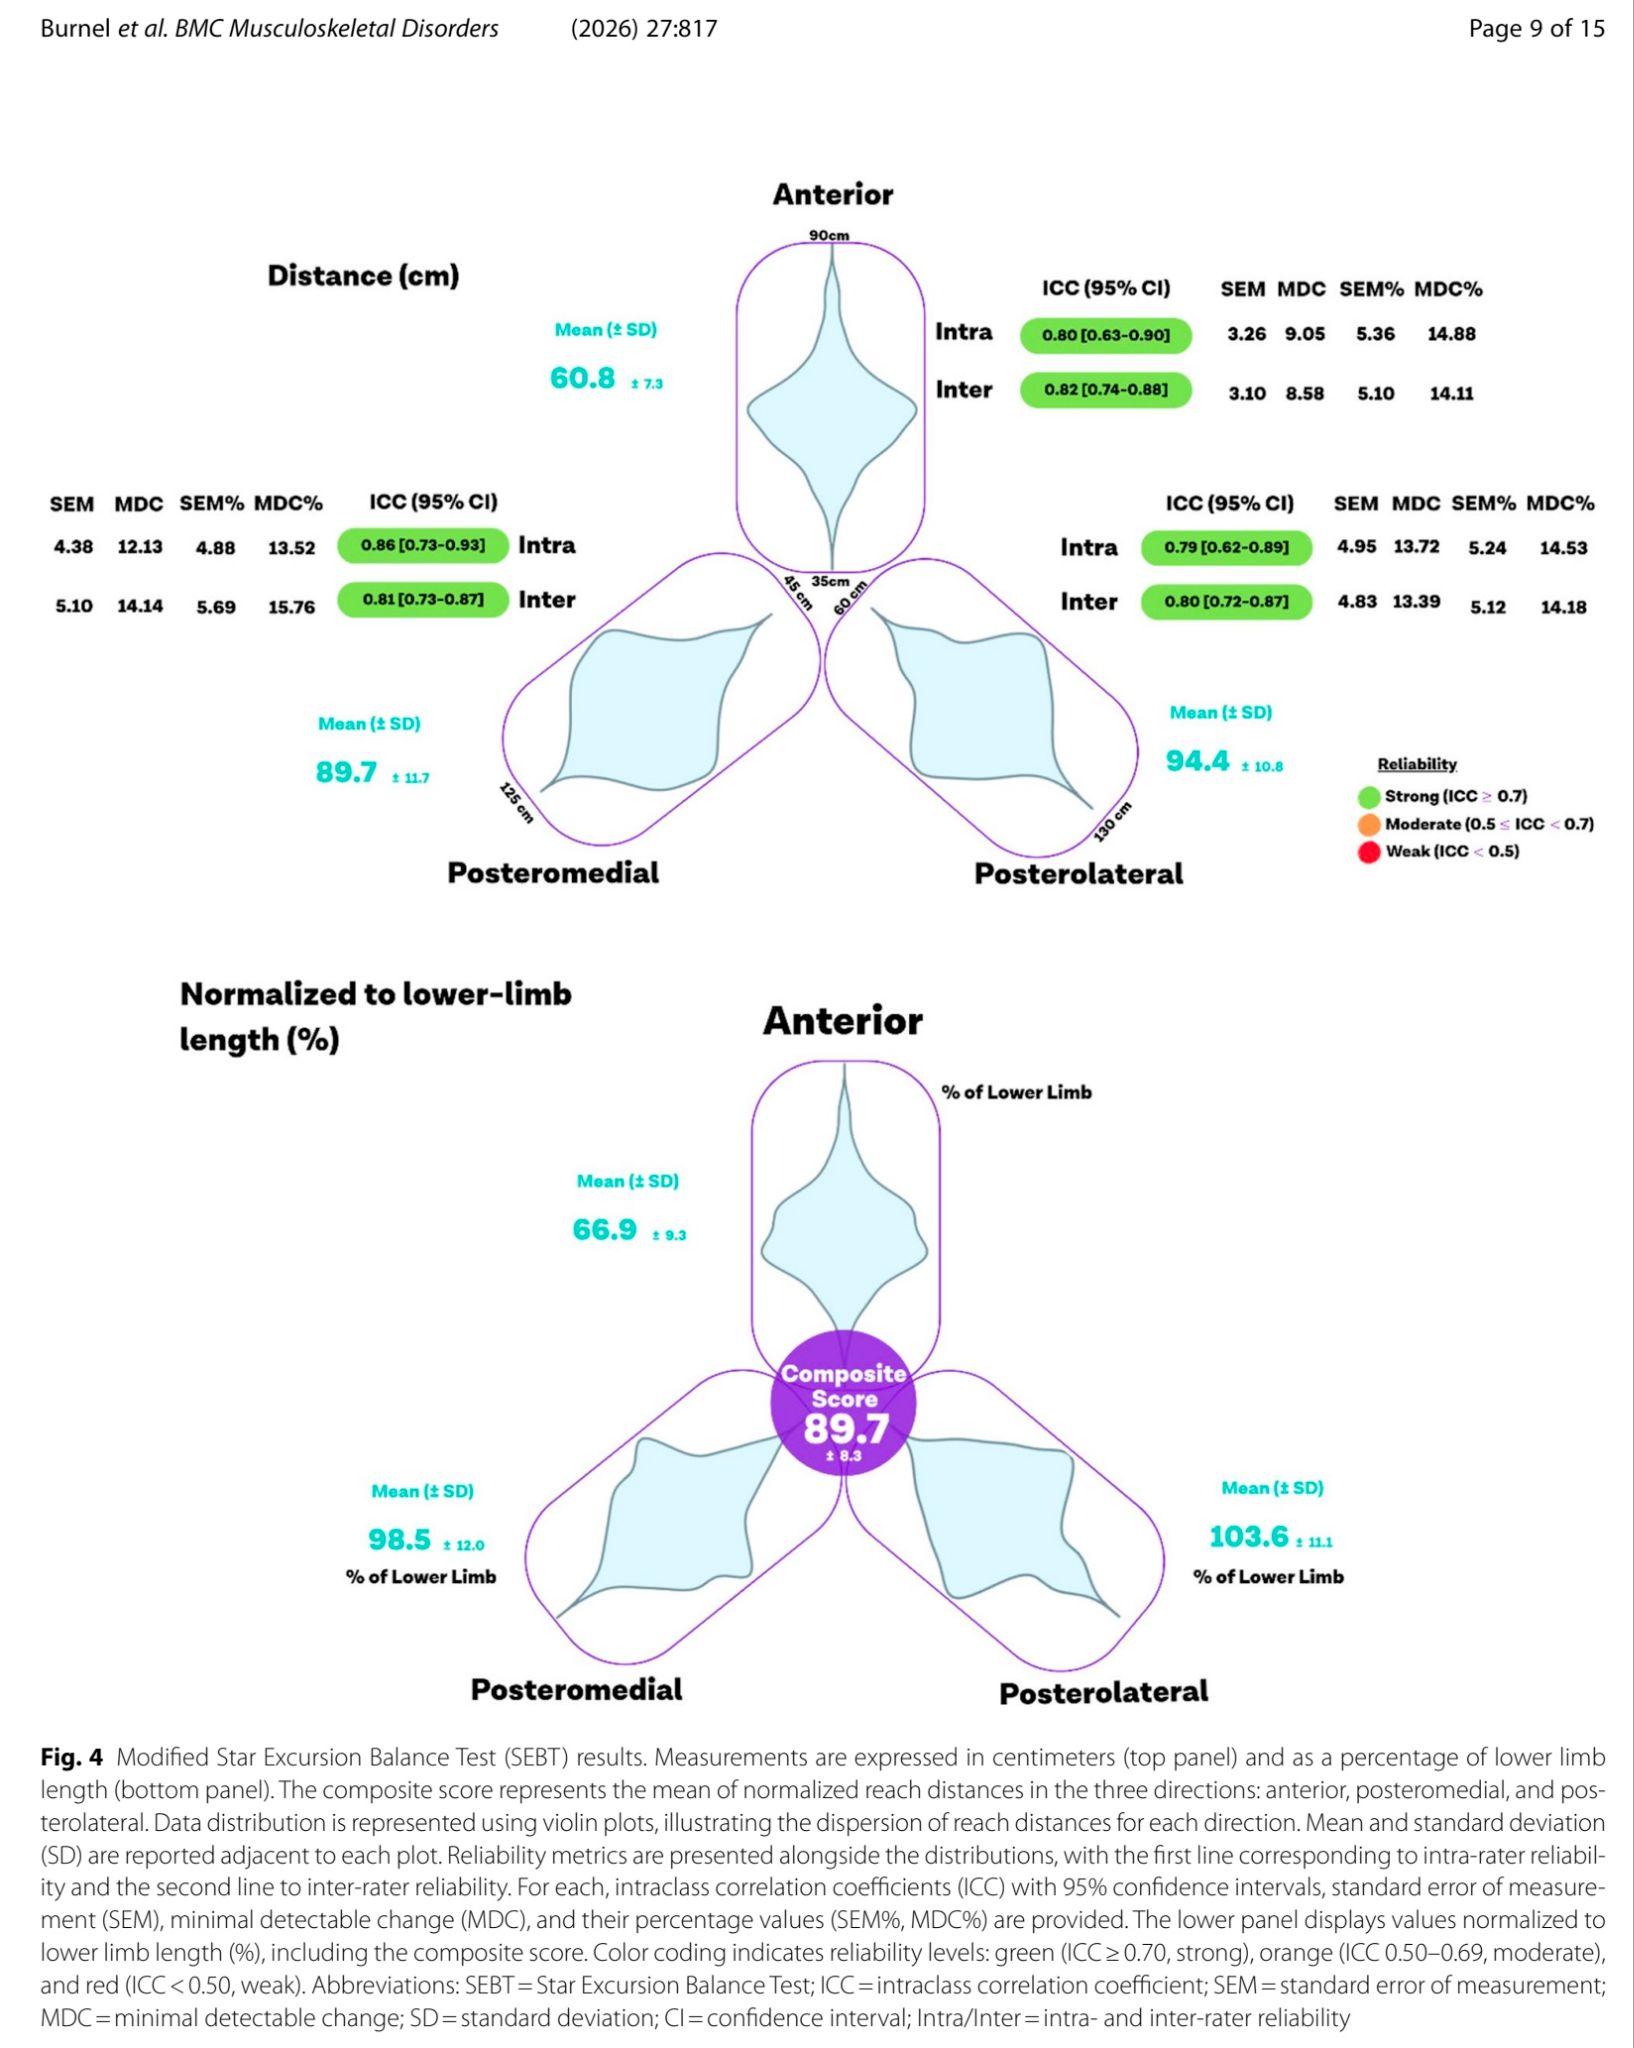
Modified Star Excursion Balance Test (SEBTm), normalized for limb length (greater trochanter to the floor). Reach distances were expressed as a percentage of limb length using the following formula, and a composite score was calculated as the mean of the 3 normalized directions.

From: Burnel et al., BMC Musculoskelet Disord. (2026)
Results
A healthy active sample of 94 volunteers (mean age 28.4 ± 8.5 years, 39% women) completed the full test battery. Twenty were retested after 7 ± 2 days for intra-rater reliability.
From: Burnel et al., BMC Musculoskelet Disord. (2026)
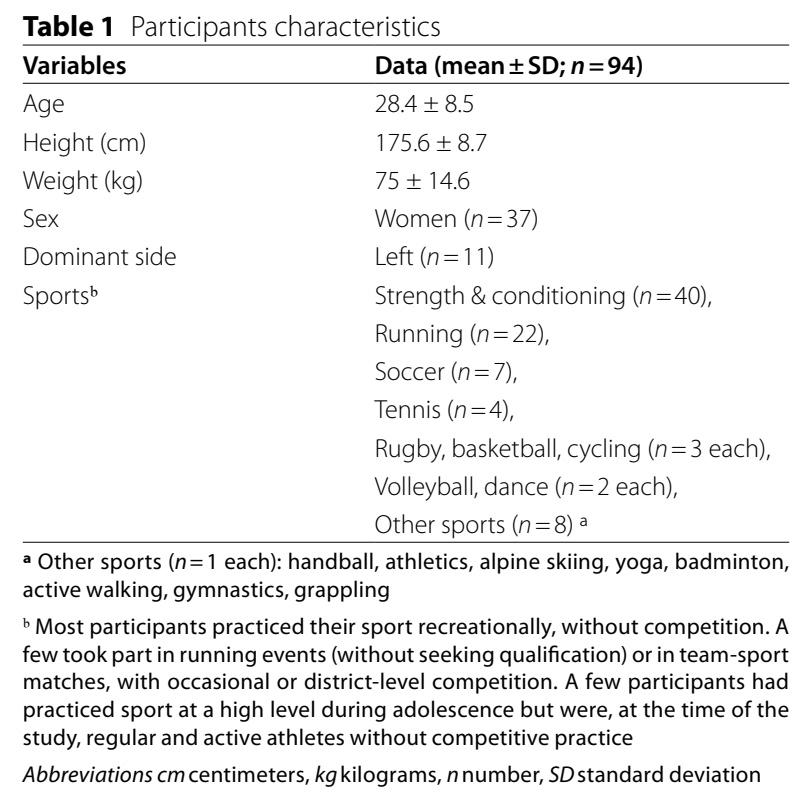
Active and passive hip flexion showed the best ROM reliability (ICC 0.76-0.85; MDC 12-18°), while external rotation in flexion was poor (ICC ≤ 0.44 active, ≤ 0.32 passive).
From: Burnel et al., BMC Musculoskelet Disord. (2026)
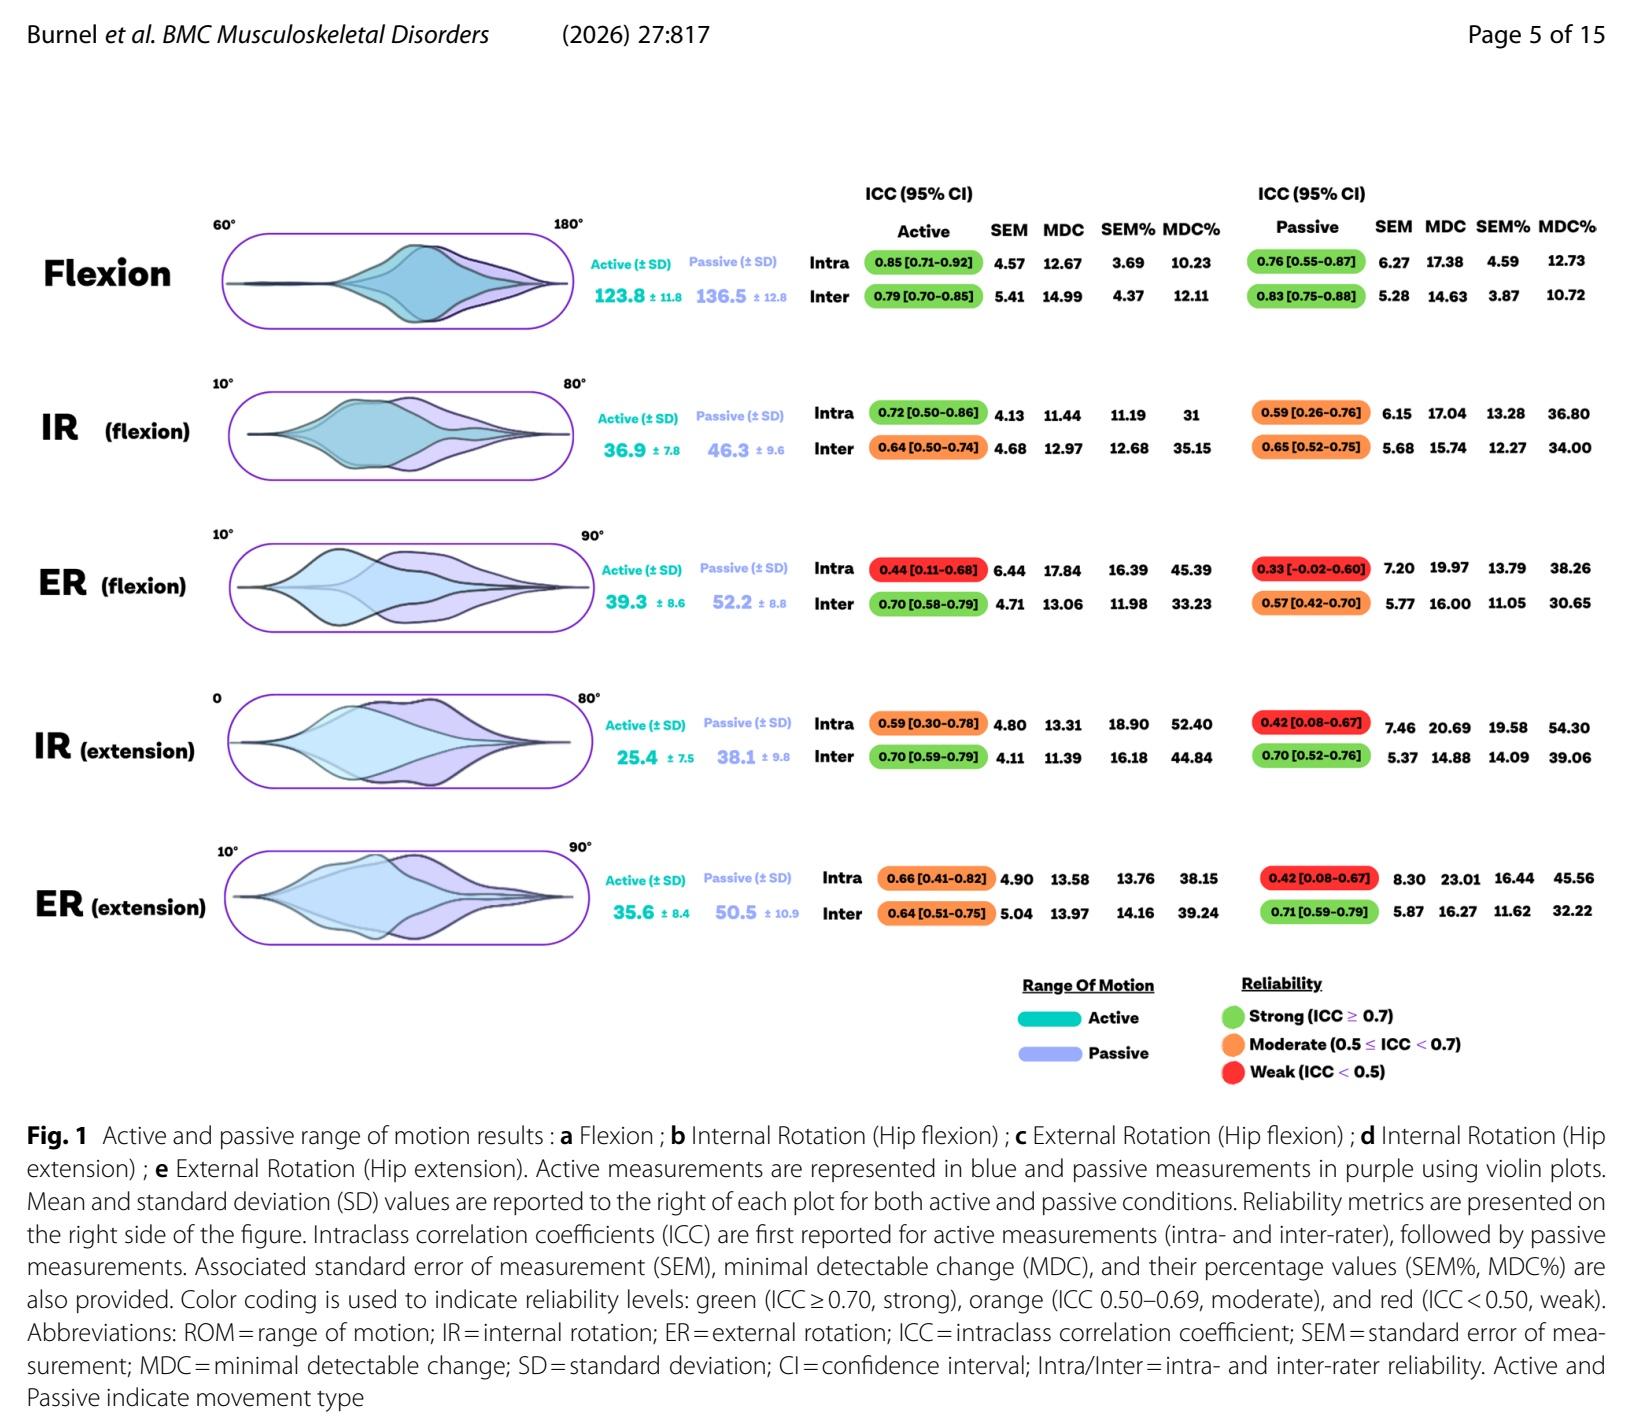
Most strength measures showed good reliability (ICC > 0.70), but with substantial measurement error (MDC 55-79 N, SEM% 14-18%, MDC% 40-48%). The adductor/abductor strength ratio was poorly reliable (ICC 0.46 intra, 0.31 inter).
From: Burnel et al., BMC Musculoskelet Disord. (2026)
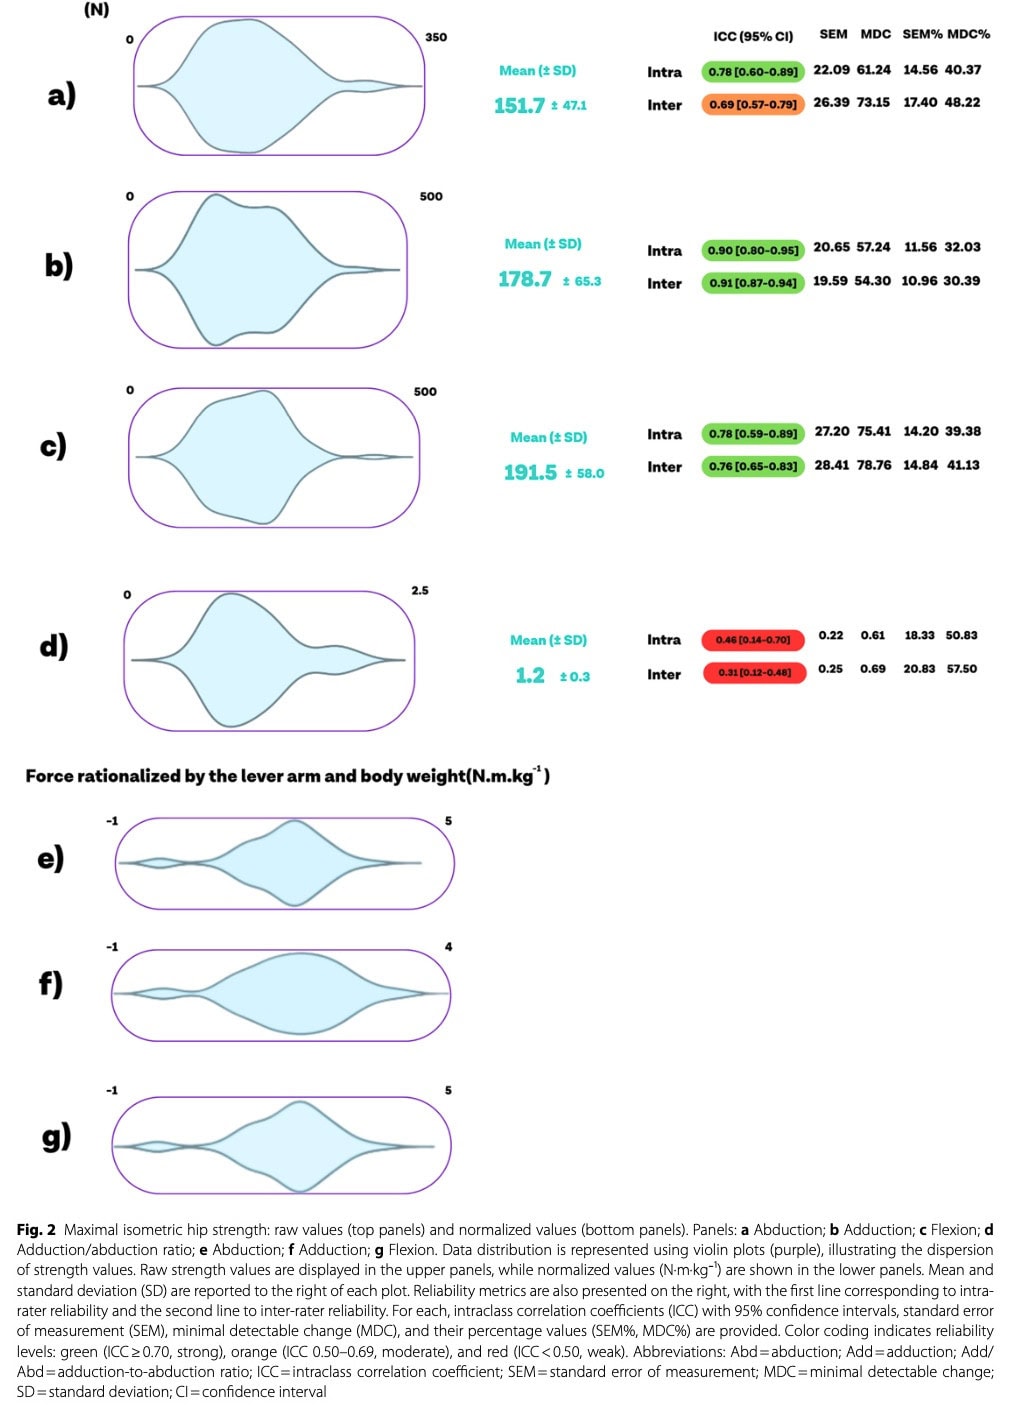
Among functional tests, the medial hop was excellent in terms of reliability (ICC 0.89-0.95; MDC 18-26 cm). Participants covered a mean distance of 92.5cm (± 28.8cm), corresponding to a normalized ratio of approximately 1.0.
From: Burnel et al., BMC Musculoskelet Disord. (2026)
The SEBTm also showed good reliability across all directions (MDC 9-14 cm). The normalized reach was 66.9% in the anterior, 98.5% in the posteromedial, and 103.6% in the posterolateral direction, and the composite score was 89.7%. Single-leg squat (ICC 0.48-0.50) and squat endurance (ICC 0.36-0.82) performed poorly.
From: Burnel et al., BMC Musculoskelet Disord. (2026)
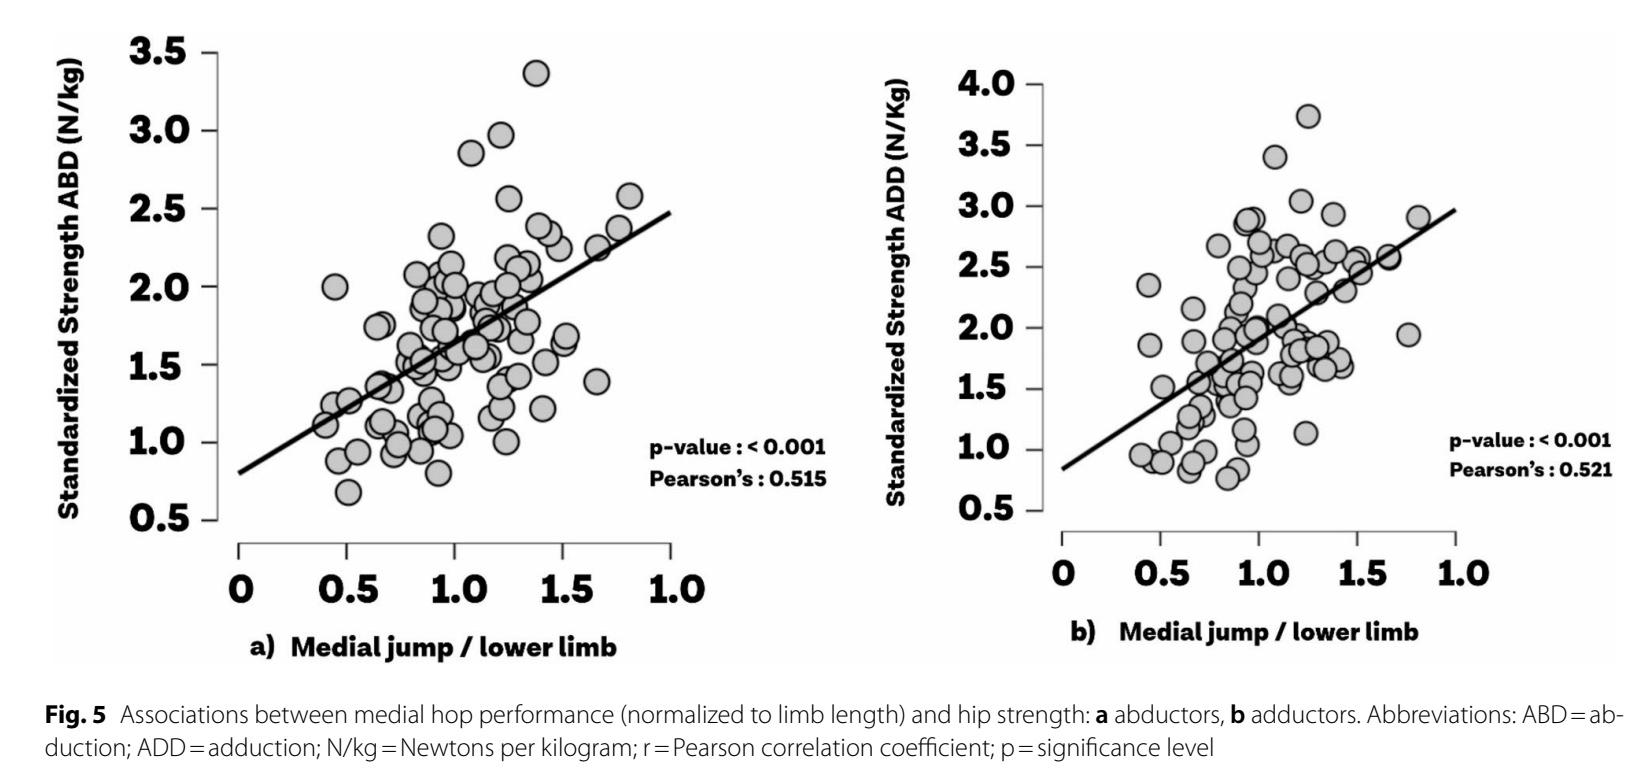
The medial hop normalized to limb length correlated moderately with abductor (r = 0.52) and adductor strength (r = 0.51). Strength of these muscle groups explained approximately 27% of hop performance variance.
From: Burnel et al., BMC Musculoskelet Disord. (2026)
The headline finding: despite LSI values suggesting near-perfect symmetry (99.0 ± 17.1% for hip flexion, 104.4 ± 10.9% for medial hop), every single LSI measure showed poor reliability (ICC < 0.50), with MDC ranging from 11.9% to 47.9% (mean ≈27%). This means that only relatively large changes were reliable, as they could exceed the measurement error, while small changes weren’t. Bland-Altman limits of agreement were widest for strength-based LSI (±29% to ±33%) and narrowest for SEBT LSI (±10-12%).
Questions and thoughts
The most striking number here isn’t a reliability coefficient; it’s the MDC of approximately 27% for the LSI. That means if your patient’s LSI moves from 75% to 95% between sessions, you still can’t be fully sure that’s a real change versus noise. And the commonly used 90% LSI cut-off for return-to-sport clearance sits squarely within that measurement error zone for most parameters.
Why does this happen even when the underlying tests (like the medial hop or hip flexion) are themselves reliable? Because the LSI is a ratio, and ratios combine the measurement error of both limbs. This raises a more fundamental, often-overlooked issue: the “healthy” contralateral limb used as the denominator is not a stable reference, as we already discussed in a recent ACL research review. It can detrain after injury, or it can actually get stronger through compensatory loading during rehab, as a prior study on ACL reconstruction patients found (the uninvolved limb’s strength can rise above pre-injury values, making it a literal “moving target”). Either way, you’re comparing your injured limb to a reference that’s shifting underneath you.
Clinically, this reframes what “90% LSI” even means. A measured LSI of 85% could, per this data, correspond to a true value anywhere between roughly 70% and 100%. That’s not a precise clinical threshold.
It would be more clinically informative to either compare the individual patient against healthy age- and sports-matched reference data, or to reassess using a longitudinal follow-up.
Talk nerdy to me
This study followed COSMIN, GRRAS, and STROBE guidelines, which is already a notch above much of the hip reliability literature, and used a proper two-stage design (inter-rater n=94, intra-rater retest n=20 after 7±2 days). ICC, SEM, and MDC95% were all reported, which is the right combination: ICC alone tells you about relative reliability, but says nothing about how much error exists in absolute terms, which is exactly where several strength measures looked fine on paper (ICC > 0.70) but had MDC% up to 48%.
A few caveats worth flagging before you overhaul your protocol. Testing order was fixed (ROM, then strength, then functional tests) rather than randomized, deliberately mirroring how the battery would be used clinically, but this means fatigue effects on the later functional tests can’t be fully excluded, even though the authors argue this wouldn’t bias the reliability estimates themselves since the order was constant across sessions.
The sample was drawn from healthy recreational adults (engaging in ≥2 sessions/week, no elite athletes), so reference values and MDC estimates may not transfer directly to a competitive athletic population, and might even be conservative given the limited familiarization with maximal effort testing in this cohort. Also worth noting: significant proportional bias (heteroscedasticity) was found for some LSI measures, meaning the error isn’t even constant across the range of scores; it tends to get worse as symmetry improves, which is a particularly inconvenient property for a metric meant to confirm “readiness.”
Take-home messages
Stop relying on the Limb Symmetry Index as a standalone return-to-sport criterion. Its poor reliability (ICC < 0.50) and large MDC (~27%) mean small, clinically meaningless fluctuations can flip a patient from “pass” to “fail” on a 90% cut-off. Instead, track absolute values of your most reliable tests, active/passive hip flexion ROM, isometric strength, and the medial hop, each interpreted against its own MDC, and compare these to normative reference data rather than to the patient’s other limb.
Only use the LSI in the early stages of rehabilitation, as large asymmetries will likely exceed the measurement error, so these changes should be reliably detected. As the rehabilitation progresses, the interpretation of functional outcomes would rather be based on a continuum of results and clinical reasoning than on a dichotomous pass/fail criterion.
Assess reliable measurements. The active and passive hip flexion ROM, isometric strength of the abductors, adductors, and flexors, and the SEBTm and medial hop test demonstrated sufficient reproducibility for clinical use. The medial hop had an MDC between 18 and 26 cm, above which the difference can be interpreted as real. The SEBTm had an MDC between 9 and 14 cm.
Use a longitudinal assessment and compare with healthy reference values. This study can set an example of reference values for healthy active young adults, but we don’t know much about their sporting activities, and the sample was heterogeneous. Therefore, the values in this study might give direction, but don’t confirm these reference values as the gold standard.
Reference

