SF-36 / 36-item Short Form Health Survey / RAND-36 / MOS SF-36

SF-36 / 36-item Short Form Health Survey / RAND-36 / MOS SF-36
The SF-36/RAND-36 is widely used to measure perceived health or health-related quality of life. The instrument includes scales for physical functioning, social functioning, role limitations due to physical or emotional problems, mental health, energy, pain and general health perception. A high score corresponds to better health status.
Validity and Reliability
The SF-36 questionnaire has been validated in patients with musculoskeletal complaints and is widely used for measuring health outcomes (Wada et al. 2007). The SF-36 is advantageous in that it achieves the best balance between length, reliability, validity, responsiveness, and experience, even in large populations of patients who complain of low back pain (Farzanegan et al. 2011). The SF-36 questionnaire has been used in various studies, and its validity and reliability have been confirmed (Ahmadi et al. 2017).
The SF-36 questionnaire has been shown to be valid and have internal consistency when applied to patients after spinal operations (Grevitt et al. 1997). However, the SF-36 is a generic questionnaire and has the potential disadvantage of being less sensitive to clinical change in patients with complaints specific to an anatomical region or disease process (Wada et al. 2007). In conclusion, the SF-36 questionnaire is a valid and reliable tool for measuring health outcomes in patients with musculoskeletal pain, but its sensitivity to clinical change in patients with specific complaints may be limited.
Scoring and Interpretation
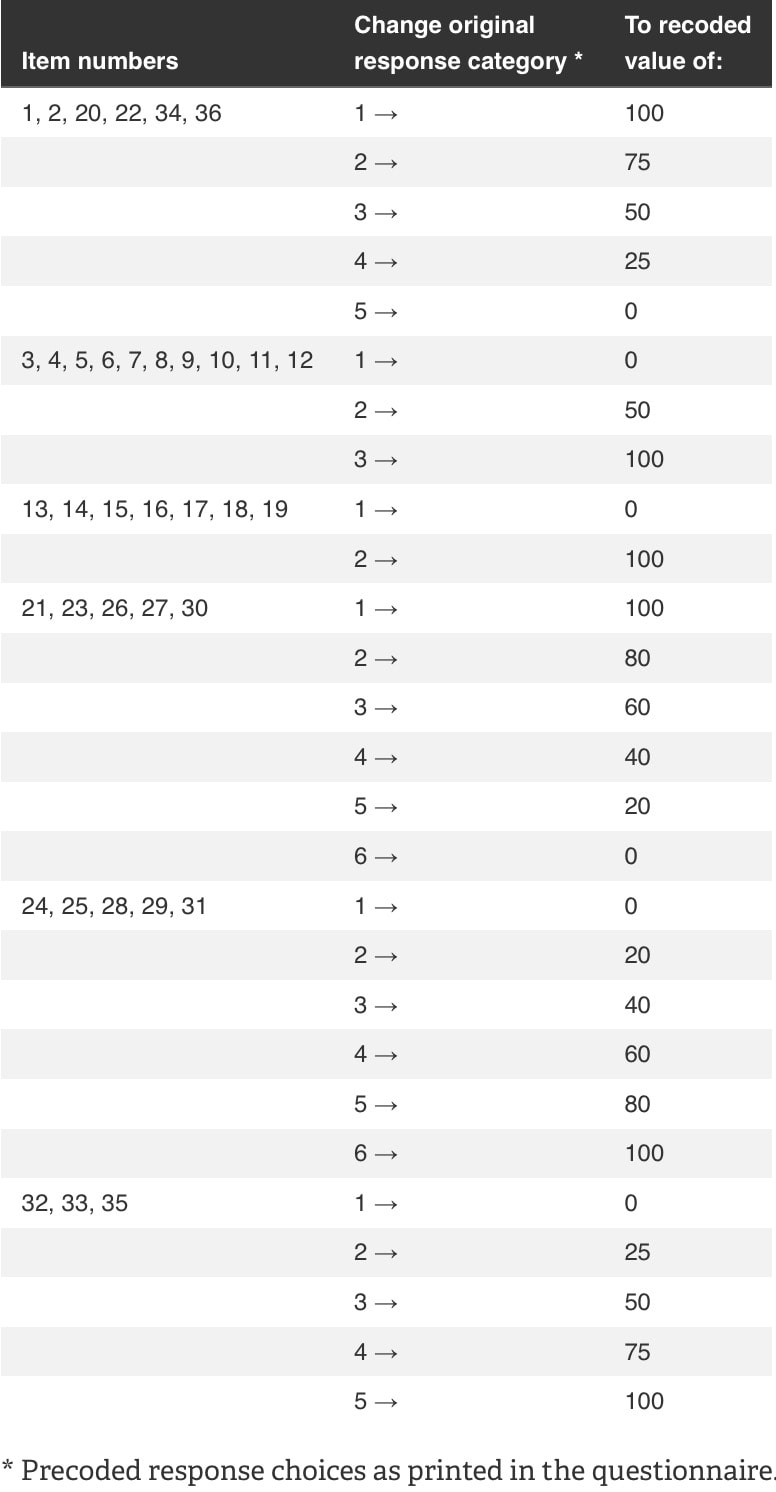
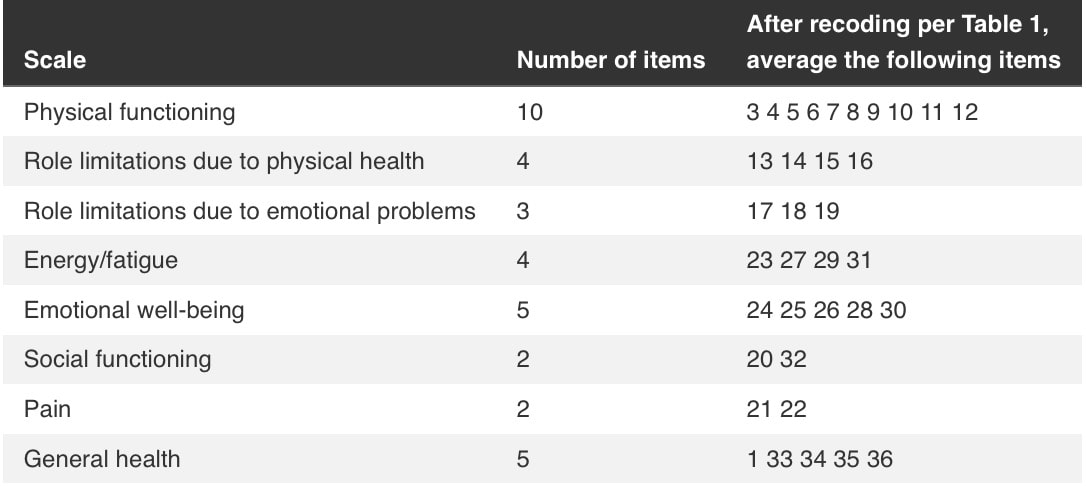
The SF-36 is scored in two steps. Precoded numerical values are first recoded in accordance with the scoring key in Table 1. Keep in mind that each item is rated, and a higher number indicates that the subject is in better overall health. Also, each item is graded on a scale of 0 to 100, with 0 and 100 serving as the lowest and highest possible scores. Scores show the proportion of the possible score that was actually obtained. The eight scale scores are produced in step 2 by averaging the items on the same scale. Table 2 provides the components that were averaged to get each scale. The scale scores are not based on items with missing data (items that are left blank).
Scale scores therefore represent the average of all items on the scale that were answered by the respondent.
Example: The social functioning scale is scored using items 20 and 32. There are 5 possible answers for each of the two items. The presence of social functioning restrictions is indicated by a high score (answer choice 5) on item 20, whereas the absence of social functioning constraints is indicated by a high score (response choice 5) on item 32. Table 1 demonstrates that responses 1 through 5 for item 20 should be recoded to values of 100, 75, 50, 25, and 0 accordingly in order to score both items in the same manner.
It is necessary to recode responses 1 through 5 for item 32 to the corresponding values of 0, 25, 50, 75, and 100. According to Table 2, the social functioning scale should be created by averaging these two recoded items together. The score of the respondent will be the same as the non-missing item if one of the two items is missing.
SF-36 Online Calculator
References
Copyright Notice
When available, sources are cited, and the tool’s developer retains ownership of the intellectual property. We consider that the modification and creation of these tools into dynamic, interactive, online scoring calculators is fair usage. Please email us if you believe we have violated your copyright so we can take down the offending material.